Power BI and Business Central: The perfect combination for data-driven decisions
Microsoft Dynamics 365 Business Central is a powerful ERP system that centrally manages all relevant company data—from finance to purchasing and sales to production. But data alone is only valuable if it is understandable and visually presented. This is where Power BI comes in. Just as radar detects obstacles or storms before they become visible, Power BI identifies trends and deviations before they become a problem.

Power BI is a leading business intelligence tool that analyzes data from various sources and displays it in interactive dashboards.
The combination of both systems offers decisive advantages:
- Business Central as a data supplier: All ERP data is structured and consistent, ideal for analysis.
- Power BI as an analysis and visualization tool: Complex data is converted into understandable graphics and KPIs.
- Real-time insights: Direct integration allows companies to access up-to-date key figures at any time.
- Better decisions: Visualized data facilitates strategic and operational decisions.
Areas of application for Power BI
Finance & Controlling
The days of static monthly reports are over. Instead of wasting valuable time on manual “Excel battles,” Power BI enables automated, company-wide consolidation. Get a clear view of liquidity, sales, and profitability at the touch of a button—anytime, with daily updates.
Production & Operations
In production, meaningful reporting acts as an early warning system. For example, the utilization of machines and workstations can be tracked. If critical thresholds are approached, countermeasures can be initiated proactively. Or, by visualizing inventory changes, Power BI provides clear visibility of WIP.
Purchasing & Supply Chain
A resilient supply chain is a critical competitive advantage today. Intelligent data analysis helps to ensure delivery capability and optimize warehouse management. This allows you to avoid unnecessarily tied-up capital while still maintaining the exact inventory levels necessary for smooth production.
Professional Services
In service-oriented areas, the key to success lies in the profitability of projects. Consistent reporting makes project progress transparent and identifies potential budget bottlenecks at an early stage. The result is projects that are not only completed on time, but also remain economically profitable.

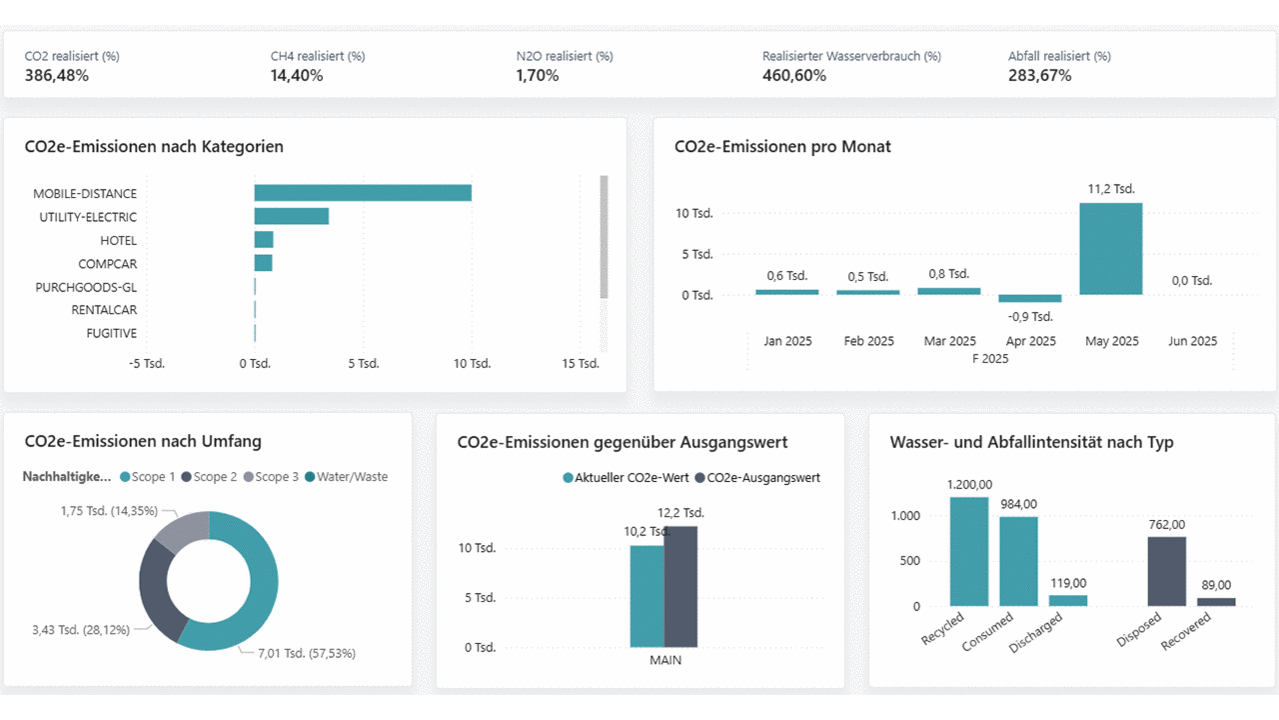
Sustainability: Your sustainability overview
The dashboard shown visualizes key ESG (environmental, social, governance) reporting metrics and demonstrates how companies can monitor their sustainability goals. The data comes from Business Central and is presented interactively in Power BI.
Benefits for companies:
This dashboard provides a clear overview of environmental metrics and supports compliance with sustainability guidelines such as the Corporate Sustainability Reporting Directive (CSRD). By combining Business Central as a data source and Power BI as a visualization tool, companies can:
- Transparently monitor emissions and resource consumption.
- Identify trends and derive measures.
- Automatically generate ESG reports.
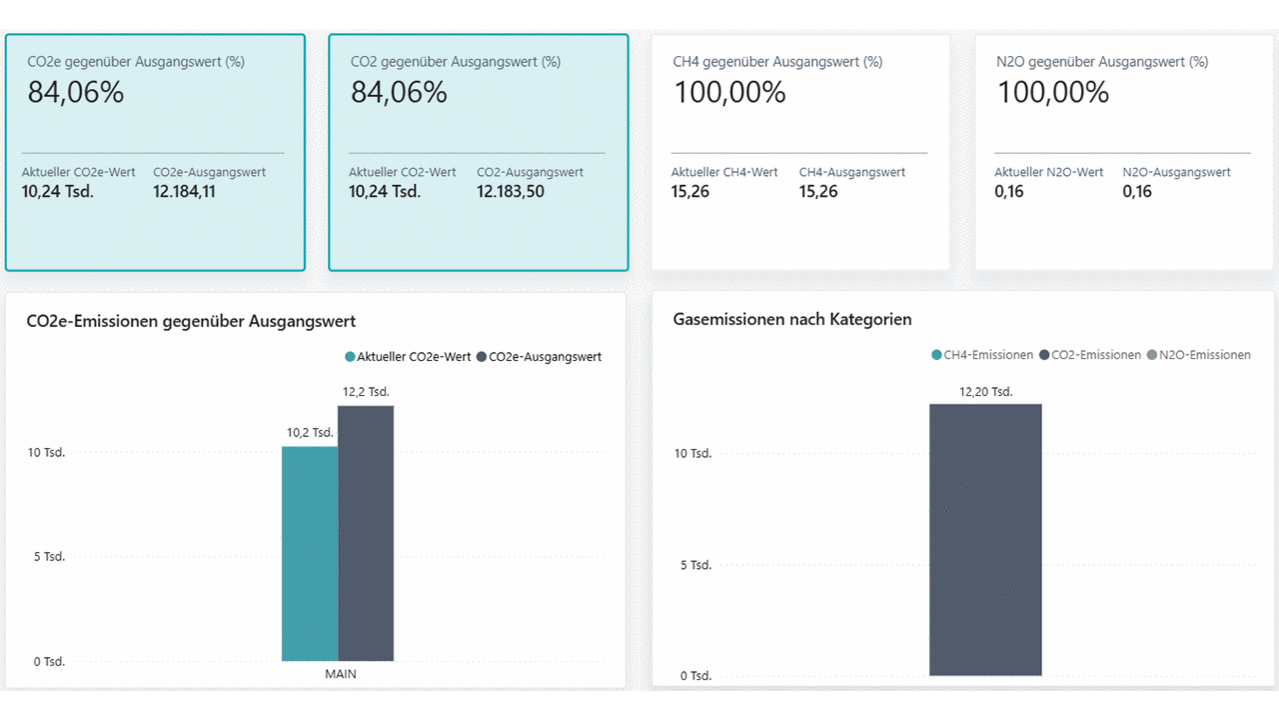
Actual emissions vs. baseline
The dashboard shown provides a clear overview of current emission values compared to baseline values.
Benefits for companies
- Transparency and control: Companies can monitor their emission trends against their set targets.
- Sustainability strategy: The data helps to plan and implement measures for further CO2 reduction.
- Compliance and reporting: Facilitates compliance with legal requirements such as CSRD (Corporate Sustainability Reporting Directive).
- Risk management: Early detection of deviations enables proactive action.
- Communication: Visualized key figures are ideal for internal reports and external ESG communication.


“Data only gains strategic value when it provides clarity—Power BI transforms information from Business Central into insights that enable executives to take targeted action.”
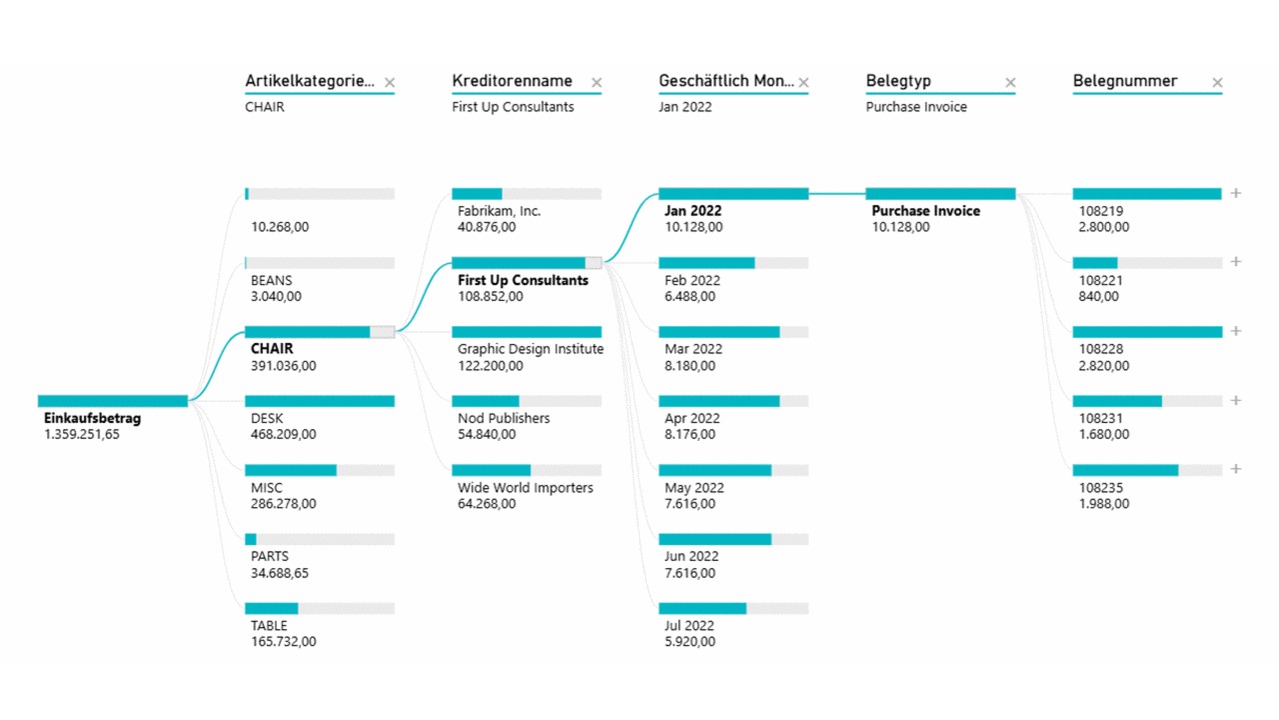
Purchasing
The dashboard shown visualizes the total purchase amount and enables detailed analysis across multiple dimensions. The data is presented in a hierarchical structure.
Benefits for companies
- Transparency in purchasing: Companies can immediately see which product categories and suppliers are incurring the highest costs.
- Cost optimization: The drill-down function allows potential savings to be identified, e.g., through better terms with certain suppliers.
- Efficient control: The ability to analyze down to the document level makes it easier to check invoices and track expenses.
- Strategic decisions: Data-driven negotiations with suppliers and optimization of the purchasing strategy are supported.
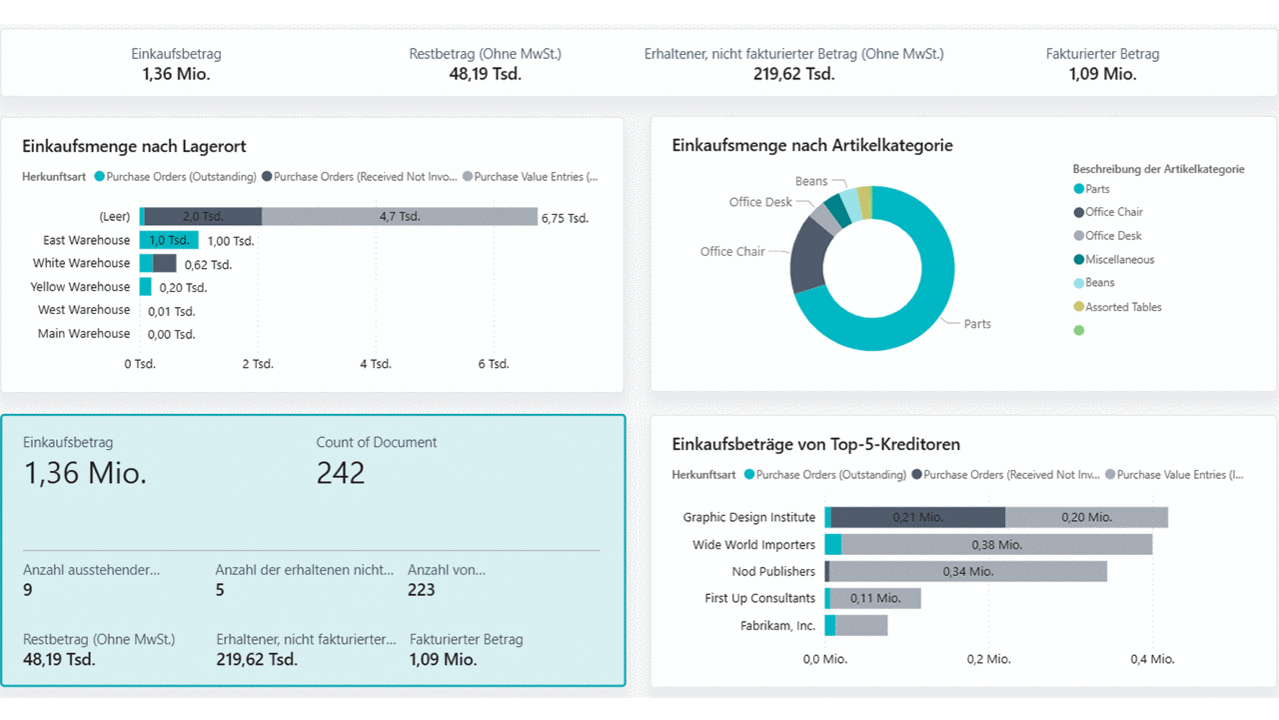
Purchasing overview
The dashboard provides a comprehensive overview of a company's purchasing activities.
Benefits for companies
- Transparency and control: Companies can see at a glance where the largest purchasing volumes arise—by storage location, item category, and supplier.
- Cost optimization: Identification of main suppliers and product groups enables targeted negotiations and better terms.
- Increased efficiency: An overview of open orders and unbilled amounts supports liquidity management.
- Strategic planning: Data-based decisions on warehousing and purchasing strategy are made easier.
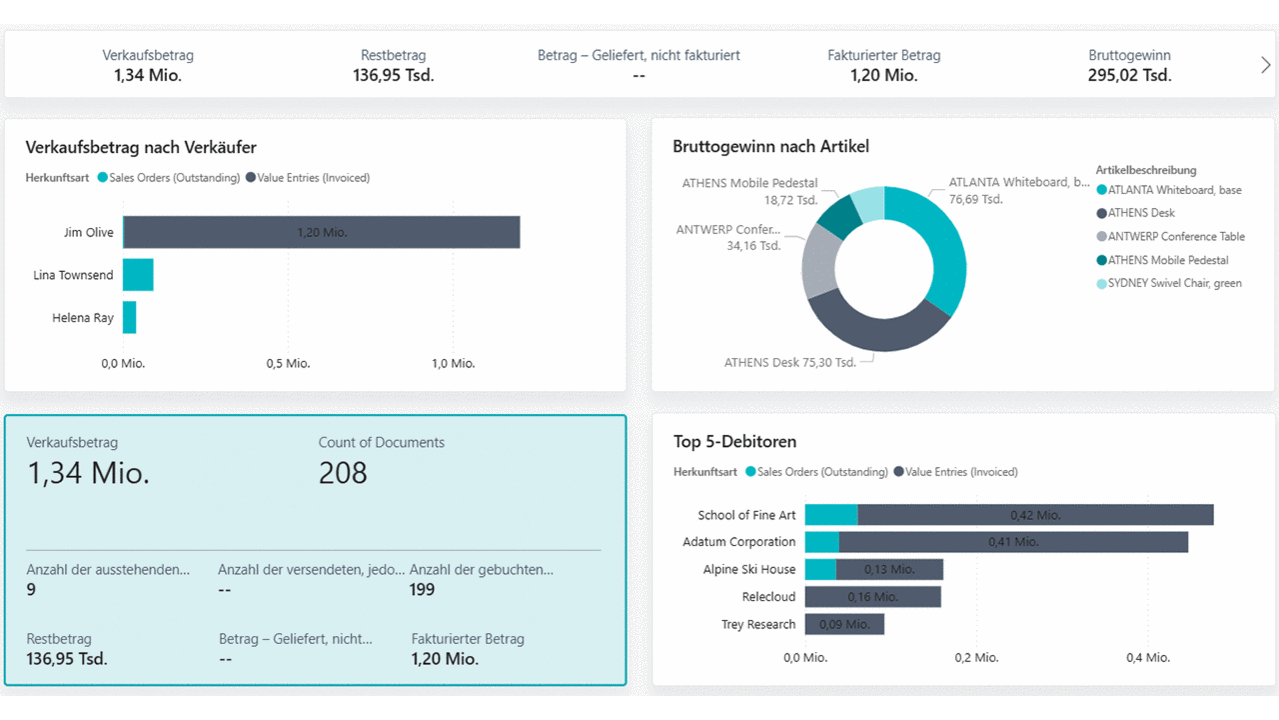
Sales
The dashboard provides a detailed overview of sales activities and sales performance.
Benefits for companies
- Sales management: Companies can immediately see which salespeople are achieving the best results and can provide targeted coaching or incentives.
- Product range optimization: Analyzing the gross profit per item helps to identify high-margin products and adjust the portfolio accordingly.
- Customer management: Focusing on top debtors enables targeted customer retention and increased sales.
- Liquidity planning: An overview of open orders and invoiced amounts supports financial planning.
- Strategic decisions: Data-driven insights for pricing, sales strategy, and resource planning.
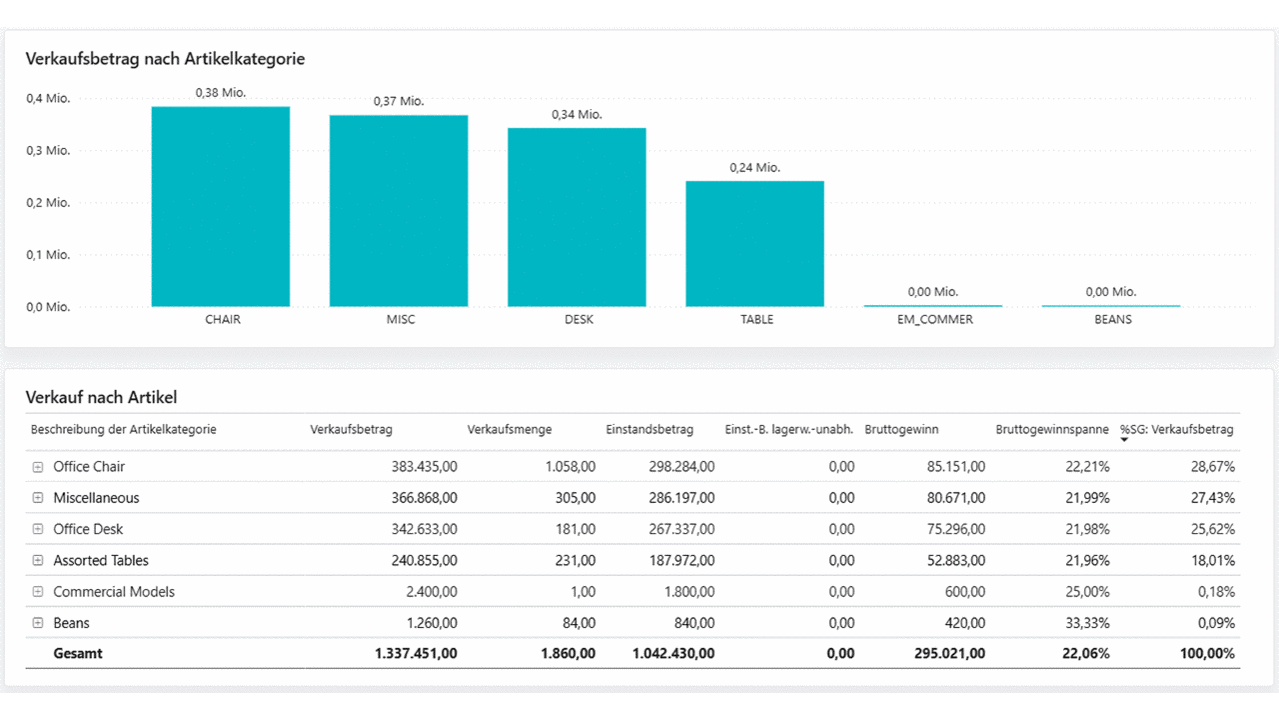
Sales by item
The dashboard provides a detailed overview of sales performance by category and individual items.
Benefits for businesses
- Assortment optimization: Businesses can identify which items and categories generate the highest sales and profits.
- Margin control: The gross profit margin per item enables targeted pricing strategies and product decisions.
- Sales focus: Resources can be concentrated on high-margin products.
- Cost control: Comparing cost prices and sales prices helps to monitor profitability.
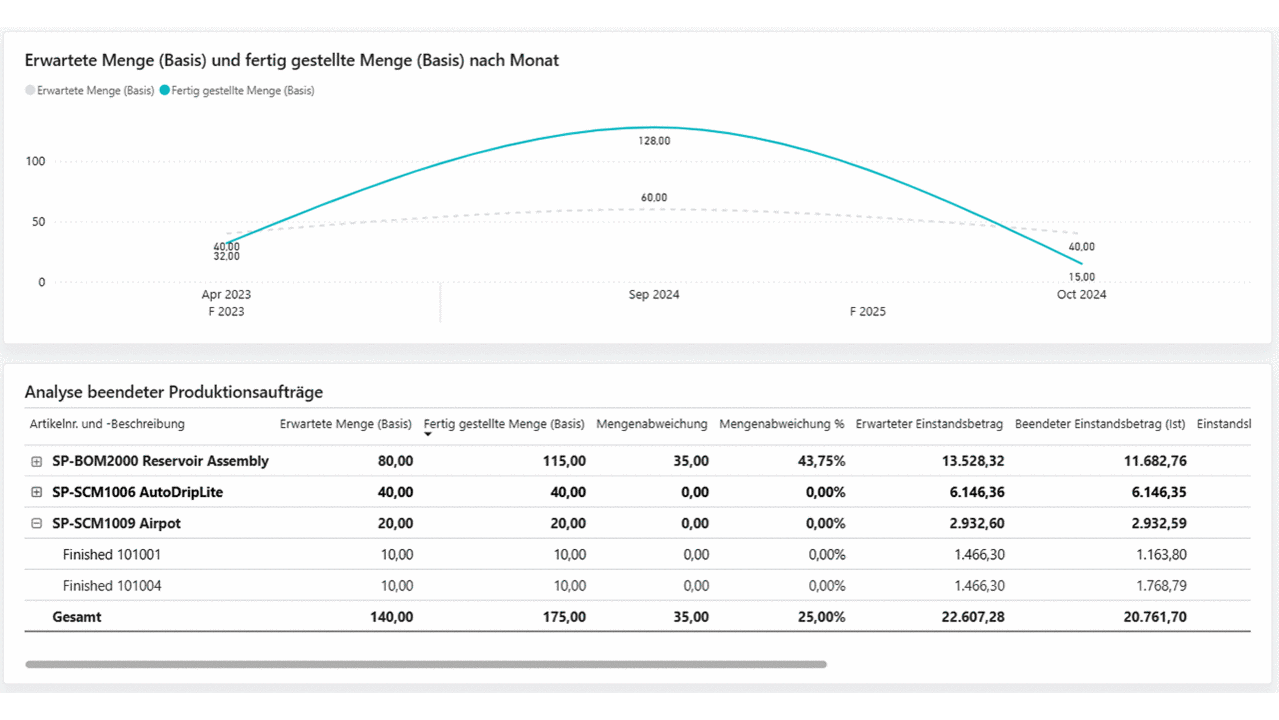
Manufacturing
The dashboard provides a detailed overview of production output and any deviations.
This analysis enables precise evaluation of production output and cost control.
Benefits for companies
- Production control: Companies can immediately see whether production volumes exceed or fall short of planning.
- Cost control: Comparing expected and actual costs helps to identify budget deviations at an early stage.
- Increased efficiency: Analysis of volume deviations enables optimizations in production planning.
- Resource management: Overproduction can be avoided to reduce storage costs and capital commitment.
- Strategic decisions: Data-driven insights for capacity planning, material procurement, and production processes.
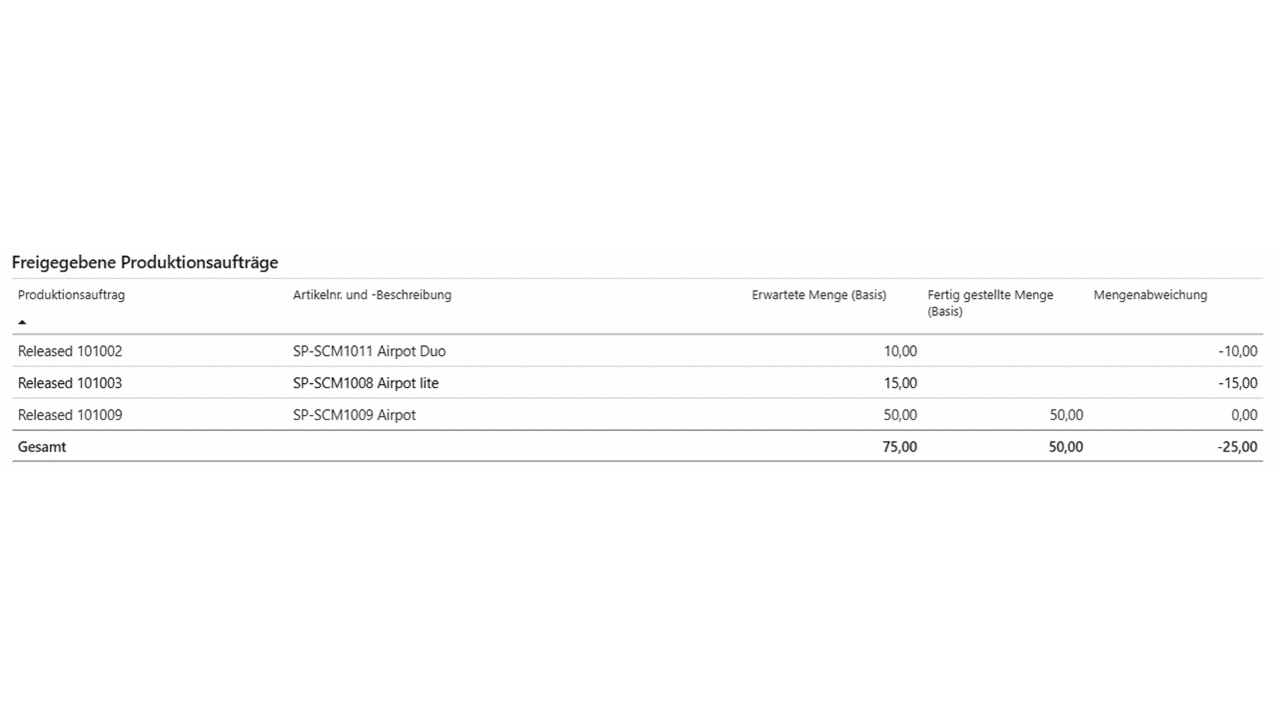
Approved production orders
The dashboard provides an overview of currently approved production orders and their quantity deviations.
Benefits for companies
- Real-time production monitoring: Companies can immediately identify which orders are behind schedule and take corrective action.
- Increased efficiency: Analyzing deviations helps identify bottlenecks and problems in the production process.
- Resource planning: Early detection of delays enables better planning of material, personnel, and machine capacities.
- Adherence to deadlines: Transparency regarding open and completed orders supports adherence to delivery dates.
- Cost control: Avoidance of production downtime and overtime through proactive control.
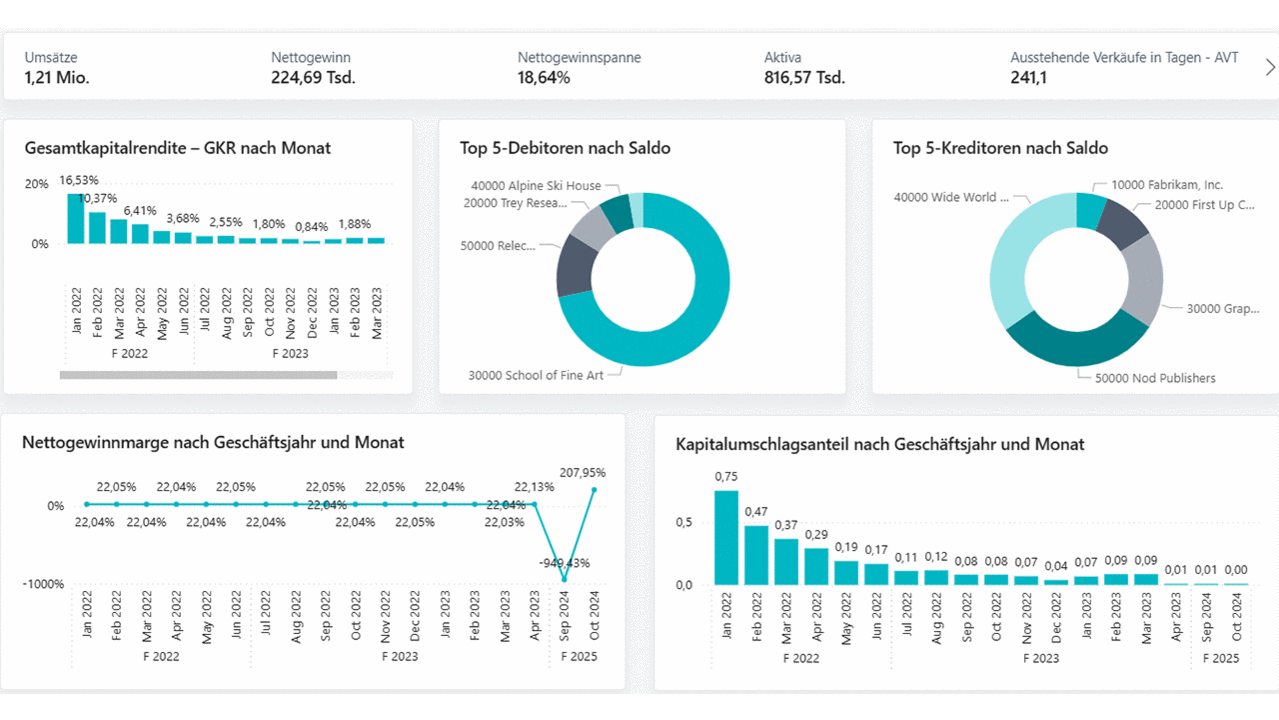
Finance
The dashboard provides a comprehensive overview of the company's financial performance.
Benefits for companies
- Financial transparency: Companies gain a clear overview of sales, profits, and return on investment.
- Liquidity management: Analysis of top debtors and creditors supports receivables and payables management.
- Profitability control: Development of net profit margin and capital turnover ratio shows how efficiently resources are being used.
- Risk management: Early detection of declining return on investment or high outstanding accounts enables proactive action.
- Strategic planning: Data-driven decisions for investments, cost optimization, and growth strategies.
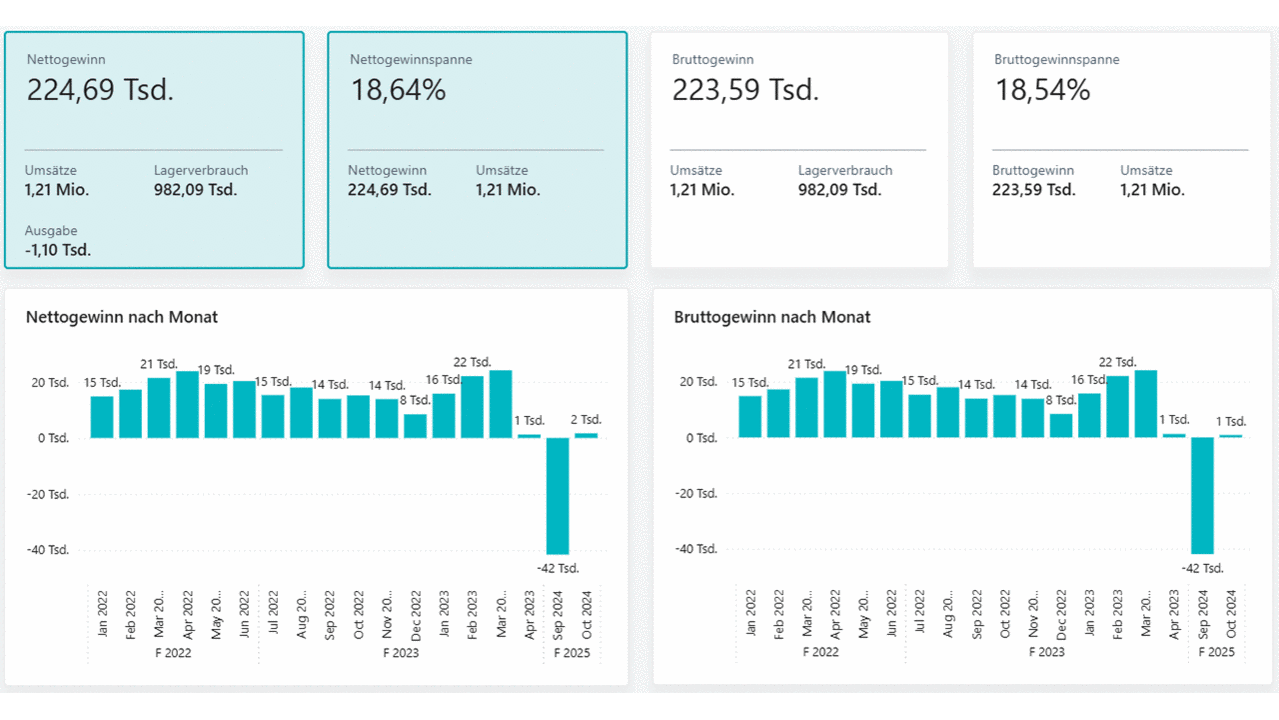
Profitability
The dashboard provides a detailed overview of the company's profit development. This analysis shows not only the overall figures, but also the fluctuations over time, which are crucial for analyzing the causes.
Benefits for companies
- Transparency regarding profit development: Companies recognize trends and can identify causes for fluctuations.
- Early warning system: Negative outliers, such as those seen in September 2024, become immediately apparent, allowing countermeasures to be taken.
- Cost and margin control: Comparing gross and net profit helps to evaluate the efficiency of the cost structure.
- Planning: Data-driven decisions for pricing, cost optimization, and investments.
- Reporting and compliance: Ideal for internal reports and external financial communication.
Conclusion: The future of reporting in BC clearly lies in combination with Power BI
While BC serves as the central operational data source, Power BI is increasingly taking on the role of strategic evaluation. Companies benefit in the long term from a clear separation between operational lists in BC and modern, interactive analyses in Power BI. The recommendation is therefore to gradually establish Power BI as the standard tool for management reports, forecasts, and trend analyses. Automated data updates, uniform KPIs, and flexible dashboards create a scalable reporting platform that grows with the company. Power BI thus lays the foundation for data-driven decisions and creates transparency across all business areas.
Book a free consultation now(neues Fenster)
This might also interest you
Invest time in building up your knowledge. This will put you in a stronger position for the future. Our webinars are also available on-demand - whatever suits you best.